Expert help to plan, build and run distributed energy

Causal Dynamics consulting helps utilities, property developers, businesses and governments get more from solar, storage, EVs and flexible load, from the first study to live operation.

Services

Choose who you are to see the services that fit. Open any card to see what we deliver.

Utilities, Business

Virtual power plant strategy

We build the business case, aggregation model and dispatch strategy for your virtual power plant, then take it through to launch.

What we deliver
  • Portfolio and revenue modelling
  • Market participation and dispatch strategy
  • Device and customer onboarding plan
  • Launch support and performance tuning
Utilities

Distribution flexibility studies

We find where flexibility can relieve network constraints and defer upgrades, and design how you procure and settle it.

What we deliver
  • Constraint and hosting-capacity analysis
  • Non-network alternative assessments
  • Flexibility procurement and settlement design
  • Real-time optimisation roadmap
Utilities

Grid edge & voltage strategy

We show how rooftop solar, batteries and EVs are changing your low-voltage network, and set inverter and voltage strategies so more customers can connect.

What we deliver
  • Low-voltage visibility and risk assessment
  • Voltage and power-quality analysis
  • Inverter profiles for station, feeder and transformer level
  • DER integration roadmap and DERMS business case
Utilities

Ancillary services & market entry

We assess which grid and market services your storage and DER can earn from, and prepare you to take part.

What we deliver
  • Revenue stack assessment
  • Registration and compliance roadmap
  • Bidding and dispatch strategy
  • Combined utility-scale and DER portfolios
Utilities, Business

Battery storage advisory

We size, site and plan the operation of batteries so each one earns more and supports low-carbon operation.

What we deliver
  • Sizing and siting studies
  • Capacity and energy co-optimisation
  • Operating strategy and trading rules
  • Ongoing performance reviews
Property & communities

Embedded networks & precinct energy

We plan and set up embedded networks with fair tenant billing and shared renewables for strata, precincts and multi-tenant sites.

What we deliver
  • Precinct energy master plans
  • Metering and tenant billing design
  • Rooftop solar, EV charging and shared storage design
  • Reporting for building managers
Property & communities

Peer-to-peer & community energy

We design local energy-sharing schemes where neighbours buy, sell and share solar, with fair and auditable settlement.

What we deliver
  • Scheme design and participant rules
  • Settlement design, including blockchain options
  • Community solar and storage integration
  • Pilot design and evaluation
Business & fleets

EV fleet electrification

We plan your move to an electric fleet: charging, site capacity, running costs and income from grid services.

What we deliver
  • Fleet and duty-cycle analysis
  • Depot charging and connection capacity planning
  • Smart charging strategy
  • Grid-services revenue assessment
Business & fleets

Commercial energy optimisation

We cut electricity costs across your sites with load analysis, on-site renewables and demand management.

What we deliver
  • Multi-site energy reviews from meter data
  • Predictive load management
  • On-site solar and storage business cases
  • Demand response participation
Business, Government

Energy procurement advisory

We run competitive, sustainability-led procurement of electricity supply, on its own or through aggregated buying power.

What we deliver
  • Aggregated procurement strategy
  • Tender preparation and supplier evaluation
  • Renewable supply and PPA options aligned with ESG goals
  • Contracting and compliance support
Business, Data centres, EV charging

Green energy certification

We visualise, track and certify the renewable energy behind data centres, businesses and EV charging stations, hour by hour.

What we deliver
  • Metering and renewable supply data brought into one record
  • Hourly green-energy matching dashboards by site and source
  • Renewable certificate tracking, including LGCs
  • Audit-ready green energy statements and certificates
Part of every engagement

AI & data analytics

We turn meter, SCADA and DER data into forecasts, alerts and decisions your teams can act on, using our platform, the systems you already run, or both.

What we deliver
  • Data audits and integration
  • Forecasting and predictive maintenance models
  • Dashboards and ESG KPI design
  • Your own algorithms deployed on live and historical data

Prove your energy is green, hour by hour

We visualise, track and certify the renewable energy behind data centres, businesses and EV charging stations, so your green claims stand up to customers, investors and auditors.

  • Data centres
  • Businesses
  • EV charging stations
  1. 01

    Track

    We connect meters, chargers and on-site generation, and bring renewable supply contracts and certificates, such as LGCs, into one record.

  2. 02

    Visualise

    Dashboards show your green share by hour, site and source, and flag the hours your demand still runs on grid power.

  3. 03

    Certify

    We issue audit-ready green energy statements and certificates for each period, ready for ESG reports, tenders and customers.

Green energy dashboard Sample data
Matched with green supplyGrid supply, not matched
79%Green share by volume
66%Matched hour by hour
16 of 24Hours drawing grid power
MWh per hour06.012.000:00 · 10.0 MWh used · 4.8 MWh matched with green supply01:00 · 10.1 MWh used · 5.1 MWh matched with green supply02:00 · 10.2 MWh used · 5.2 MWh matched with green supply03:00 · 10.4 MWh used · 5.3 MWh matched with green supply04:00 · 10.4 MWh used · 5.2 MWh matched with green supply05:00 · 10.5 MWh used · 5.1 MWh matched with green supply06:00 · 10.5 MWh used · 4.8 MWh matched with green supply07:00 · 10.5 MWh used · 8.0 MWh matched with green supply08:00 · 10.4 MWh used · 10.4 MWh matched with green supply09:00 · 10.4 MWh used · 10.4 MWh matched with green supply10:00 · 10.2 MWh used · 10.2 MWh matched with green supply11:00 · 10.1 MWh used · 10.1 MWh matched with green supply12:00 · 10.3 MWh used · 10.3 MWh matched with green supply13:00 · 10.2 MWh used · 10.2 MWh matched with green supply14:00 · 10.1 MWh used · 10.1 MWh matched with green supply15:00 · 9.9 MWh used · 9.9 MWh matched with green supply16:00 · 9.9 MWh used · 8.8 MWh matched with green supply17:00 · 9.5 MWh used · 5.6 MWh matched with green supply18:00 · 9.5 MWh used · 2.2 MWh matched with green supply19:00 · 9.5 MWh used · 2.6 MWh matched with green supply20:00 · 9.6 MWh used · 3.0 MWh matched with green supply21:00 · 9.6 MWh used · 3.5 MWh matched with green supply22:00 · 9.8 MWh used · 4.0 MWh matched with green supply23:00 · 9.9 MWh used · 4.4 MWh matched with green supply00:0006:0012:0018:0023:00
Show the hourly numbers
HourUsed (MWh)Matched green (MWh)
00:0010.04.8
01:0010.15.1
02:0010.25.2
03:0010.45.3
04:0010.45.2
05:0010.55.1
06:0010.54.8
07:0010.58.0
08:0010.410.4
09:0010.410.4
10:0010.210.2
11:0010.110.1
12:0010.310.3
13:0010.210.2
14:0010.110.1
15:009.99.9
16:009.98.8
17:009.55.6
18:009.52.2
19:009.52.6
20:009.63.0
21:009.63.5
22:009.84.0
23:009.94.4

Sample profiles for illustration. Hourly matching counts green energy only in the hour it is produced, so it can sit well below the volume share.

The grid edge is where networks need help now

Rooftop solar, batteries, EVs and flexible load now connect at the low-voltage end of the network, mostly behind the meter. These are the four problems clients bring to us most often.

Midday

Voltage rise

When rooftop solar exports at its peak, local voltage climbs. Inverters trip off, customers lose output and complaints follow.

We analyse feeder voltage and set inverter profiles at station, feeder and transformer level to keep it inside limits.

Feeders & transformers

Reverse power flow

Assets designed to deliver power one way now carry it back up the network, stressing protection settings and equipment.

We turn meter data into live constraint alerts, so you see where flows reverse before they become faults.

Evening

Steeper peaks

Solar output falls away just as demand rises, so the evening ramp is sharper than the network was planned for.

We design batteries and flexible load to be dispatched together as a virtual power plant that flattens the peak.

Control room

The visibility gap

Most devices sit behind the meter, on different brands and protocols. Operators can't manage what they can't see.

We bring every DER, asset and protocol into one view, whatever the manufacturer.

Deep expertise across networks, solar, storage and EVs

Choose an area to see where our consultants work and what we measure.

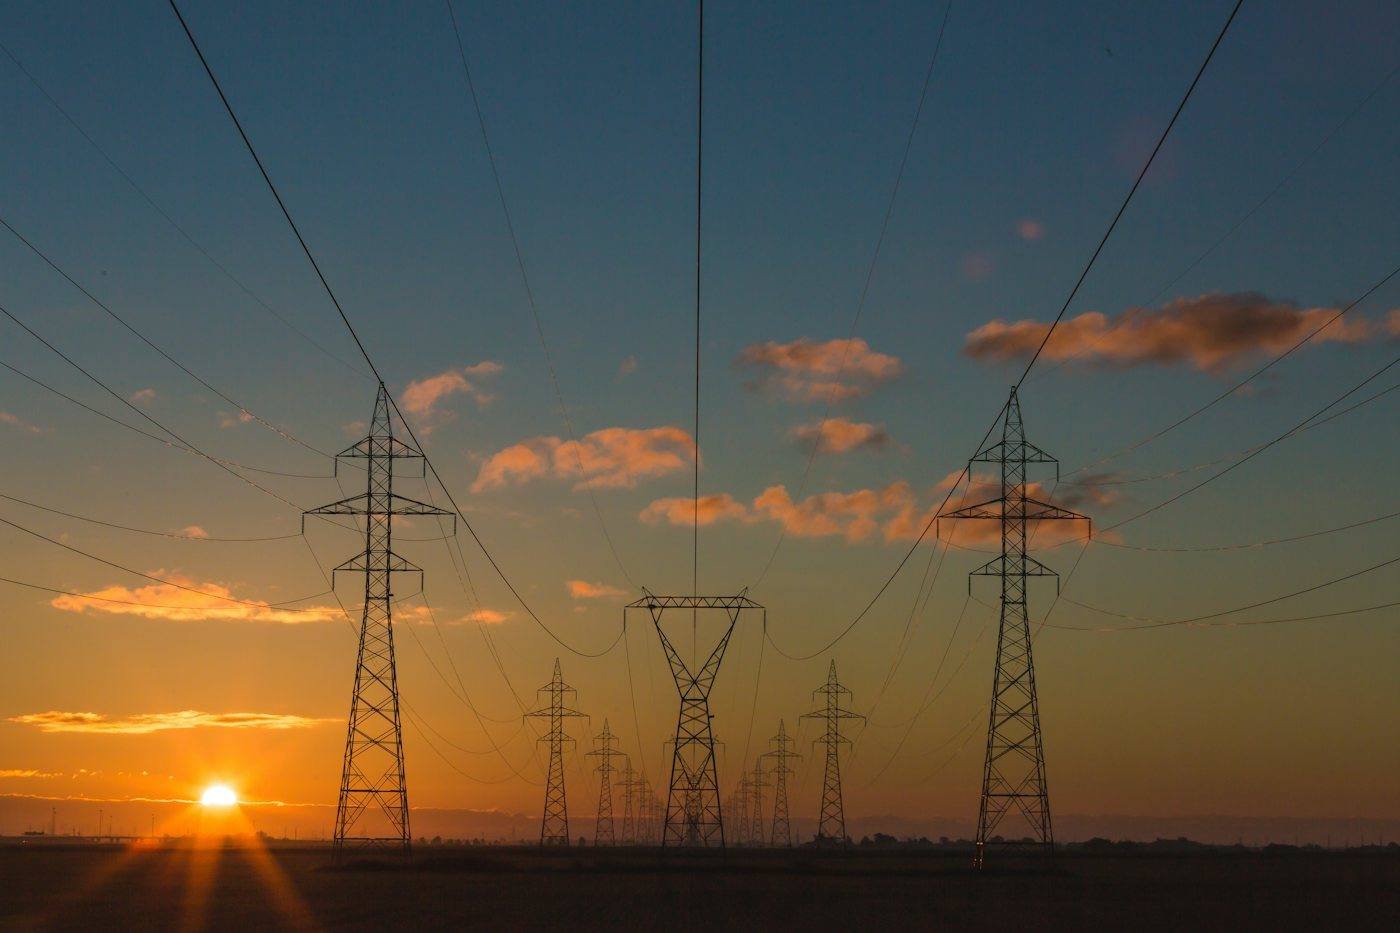
Transmission towers carrying high-voltage lines across open land at sunset Distribution networks

Keep voltage stable as rooftop solar, batteries and EVs pile on

We help networks connect more renewables, storage and peer-to-peer trading without destabilising the grid.

  • Voltage control. Inverter profile strategies at station, feeder and transformer level.
  • Capacity constraints. Meter data turned into live bottleneck alerts that feed peak-demand management.
  • Predictive maintenance. Models that spot failing assets early, so work is scheduled before outages.
Voltage puLoad kWExport kWhFrequency Hz
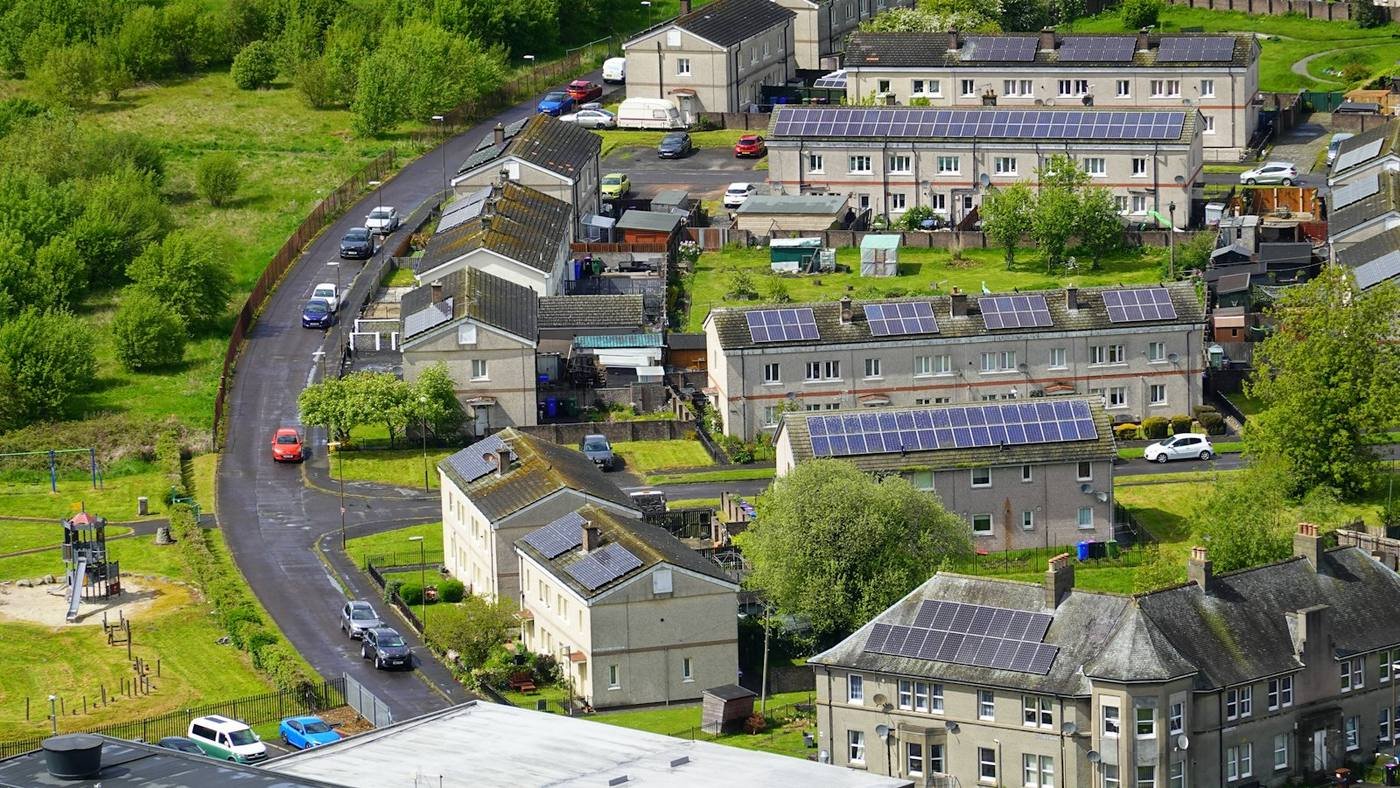
Aerial view of a residential neighbourhood with solar panels on many rooftops From study to live operation

Four stages, from first study to live operation

You can engage us for one stage or all four. Every engagement starts with the outcome you need.

  1. 01

    Assess

    We map your assets, data and constraints, and agree the outcome and how it will be measured.

  2. 02

    Design

    We model the options, build the business case and set a roadmap you can take to your board or regulator.

  3. 03

    Deploy

    We integrate devices and data, retrofit live sites without interrupting operations, then pilot and scale.

  4. 04

    Operate & improve

    We tune performance, train AI models on live and historical data, and report on outcomes and ESG KPIs.

The platform behind our consulting

When a project needs software, our consultants deploy the Causal Dynamics platform. It pulls data from the systems you already run, unifies every protocol and vendor, then puts your own algorithms to work on it, in four steps from field device to control room.

Your assets Rooftop solar & inverters Batteries & storage EV chargers & fleets Flexible loads & HVAC Smart meters & sensors Legacy SCADA & databases
Causal Dynamics platform
01

Integrate

Connect directly or through your databases. Retrofits into live projects without interrupting operations.

02

Unify

Every DER, asset and protocol in one dashboard, whatever the manufacturer.

03

Operationalise

Deploy your business algorithms and train AI/ML models on live and historical data at the same time.

04

Share

Real-time data for every department, with strict control over who sees what.

Your teams Control room & operations Asset & maintenance planning Billing & settlement Market & trading desks ESG & sustainability reporting
Plug-and-playWorks with legacy and modern systems, with less deployment time and complexity.
Multi-vendor, multi-protocolNo lock-in to one inverter, meter or battery brand.
Fewer IT bottlenecksTeams reach the data they need without waiting on IT.

Working with our consultants

Something else on your mind? Talk to our team.

How does an engagement start?

Usually with a short assessment of your network, site or portfolio and the outcome you need. From there we agree the scope, deliverables and timing.

Do we need to use the Causal Dynamics platform?

No. Our consulting stands on its own. Where a project needs software, we can deploy our platform, work with the systems you already run, or combine the two.

Can you work with our existing devices and data?

Yes. We are multi-vendor and multi-protocol. We connect to devices directly or through your existing databases, and retrofit into live projects without interrupting operations.

Can we run our own algorithms?

Yes. We can deploy your own business algorithms and train AI and machine learning models on your live and historical data at the same time.

Where do you work?

We are based in Perth, Western Australia, at 1/22 Stirling Highway, Nedlands. Talk to us about projects elsewhere in Australia.

Tell us what you're working on

Send a few lines about your network, site or fleet and what you want to change. We'll tell you how we would approach it.

Talk to our team